
Who are the voters swinging away from Christopher Luxon?
An investigation into the voters who switched from Labour to National in 2023 - and are trending away from the party now. Featuring a lot of charts.

Hello again! A good old fashioned long post full of charts today as I prepare to head home.
National have not had a good winter. Two years from entering Government with close to 40% of the vote they are now sitting far closer to 30% in most polls, save for the 1 News/Verian which sees them bobbing about at 34%. This is not a catastrophic drop, not the kind of massive tide going out that Labour saw between 2020 and 2023, but for a first term Government it is a rare thing.
These voters will be heading off into a variety of directions. NZ First seem to be polling very well. Some may have fallen into vast sea of “don’t knows”. But some do seem to be switching back to Labour, who are now polling about level with National, after losing to them by about 11 points in 2023.
Knowing exactly who these “swing” voters are is difficult. Polling companies do not publicly release that much demographic data, let alone rich questions on ideology and the like. But we do have something we can use as a bit of a proxy - the New Zealand Election Study (NZES) from the last election, which just put out its data publicly a few weeks ago.
The NZES is an incredibly detailed survey of almost 2000 voting-age adults carried out every election for decades. It surveys not just the voters but also the non-voters, validates their party votes, and asks them a dizzying array of questions, from their views on the woman’s place in the home to whether they have ever called in to talkback radio. It’s the best single set of data we have to understand New Zealand politics outside of election results themselves.
But we aren’t trying to understand the entire electorate here, we’re trying to understand the people who voted National in 2023 but are softening in their support. In other words - swing voters. Not the hardened supporters of a party but the people who float from left to right between elections.
A rough proxy for swing voters
The people in NZES were asked about their views just after the election, meaning we have no perfect notion of who has swung away from National since. But we can create a bit of a proxy by looking at people who voted for Labour in 2020 and National in 2023. Not all of these people will have switched away from National now and if they have they may have gone somewhere completely different. We also have to keep in mind that new voters turn 18 every day while others die. But this is a proxy I used in 2023 to look at Labour’s lost voters1, and it did seem to be a useful way of analysing a major party’s softest vote. After all, if you voted for National when it was doing terribly in 2020 and then again in 2023, you are probably a core National supporter unlikely to move anywhere other than to another party on the right. If, on the other hand, you voted for Labour in 2020 and then National in 2023, you are probably a lot more open for voting for Labour again in 2026.
Throughout this post I will be comparing this subset of voters to the general elector population - that’s not all New Zealanders, but it’s not just voters either, as it includes non-voters. We will call them “switchers” or “the swing vote” interchangeably. A note of caution here: Because this is a subset of a subset, the margin of error is significantly higher - close to double digits at 95% confidence. So do not treat the differences between the switchers and general voters as a perfect measure but more a general directional vibe - and if the difference is in the low single digits, it is probably just noise2.
These voters made up about a fifth of National’s total support in NZES. That may not sound like a lot, but losing it to Labour entirely would certainly be enough to lose the election, all else being equal.
So who are they?
A white woman in her 50s
Let’s start by looking at things demographically.
The typical switcher was a 56-year-old pākehā woman living in a house she owns.
This does not mean all switchers were woman or in their 50s, just that the median age was 56, and she was more likely to be a woman than a man - about 70% of these switchers were women. This puts the pay equity debate in stark relief.
As you can see from the above comparison of this “switcher” population and general electors, they came from all voting age groups - but are far more likely to be in their 50s than any other.
And as you can see above, the vast majority of switchers (about 84%) owned their own home, either with their mortgage paid off or with some still to go. When you consider how much of an issue interest rates were in 2023, this is unsurprising - and should be welcome news to National, who are pinning a lot of hope on keeping these voters by driving interest rates down.
There are other demographic lenses, but they don’t illustrate as stark a difference with the general population. Switchers were more likely to live in a large urban area than anywhere else - but so are all Kiwis these days, and the differences weren’t massive. Switchers were slightly less likely to have a professional job than the general elector - but not by a big margin. And they were more likely to be white than the wider voting population - but not by a gigantic margin, given most of the 18+ cohort are white. On income - well see below. These differences are not outside of the margin of error and largely track the general population.
In other words, outside of gender and homeownership, these swing voters or switchers track the general population fairly closely.
That’s brute level demography out of the way - now what do they actually think?
Centrists who were very worried about the economy
Let’s take a look at how these switchers think about politics and themselves.
First up is the very simple measure we have for measuring how people position themselves economically, with 0 being as far left as possible and 10 being as far right as possible.
As you can see, very few switchers describe themselves as left wing. But about half describe themselves as somewhere between 4 and 6 in the centre, a quarter or so see themselves firmly on the right, and the rest don’t know. After all, these ten point scales can be difficult to really match to the political priorities of actual people.
Before we dive into the issue-based questions, let’s talk personalities.
Christopher Luxon was leader of the National Party at the last election, and everyone in this group party voted National - so unsurprisingly they generally had a lot more time for him than the general population. But this was not the adoration that these same switchers in reverse had for Jacinda Ardern in 2020 - here’s my graph from back then looking at people who voted for National in 2017 but then Labour in 2020 (in pink).

As you can see, Ardern had far higher favourability but with the general public (just 6% strongly disliked her, compared to 21% for Luxon), and specifically with her newly-converted voters, with 41% giving her the maximum possible rating, compared to 8% of Luxon’s. But perhaps this is unsurprising - Ardern after all won MMP’s only ever majority in 2020, she was very very popular at this time.
Let’s move on to some other party leaders from 2023. Here’s Chippy.
In something of a surprise, Hipkins doesn’t do that terribly here. While plenty of switchers rate him unfavourably (38% give him a 0-4), more actually give him a positive rating (5-10) - although the are clustered in the lukewarm “5” area. Data like this gives some credence to the Labour Party strategists who are keen to keep Hipkins around. These voters all chose National at the election, yet a lot of them don’t seem to really hate Hipkins.
Let’s take a look at the two other leaders in the eventual coalition.
David Seymour gets a far better hearing from these switchers than Winston Peters does, with just over a quarter giving Seymour a negative rating compared to well over half disliking Peters - with many giving him the worst possible rating of 0.
Again, not the hugest surprise. Anyone voting for National in election 2023 knew that a coalition with ACT was the only way to power and had made their peace with that, but National teaming up with NZ First was still not a certainty at election day. Also, Peters has been in Parliament since before Seymour was born - people know him and have an opinion on him, whereas many of these swingers were still ticking “don’t know” on Seymour.
We can take a brief look at another party’s leader who is still around now - Marama Davidson3.
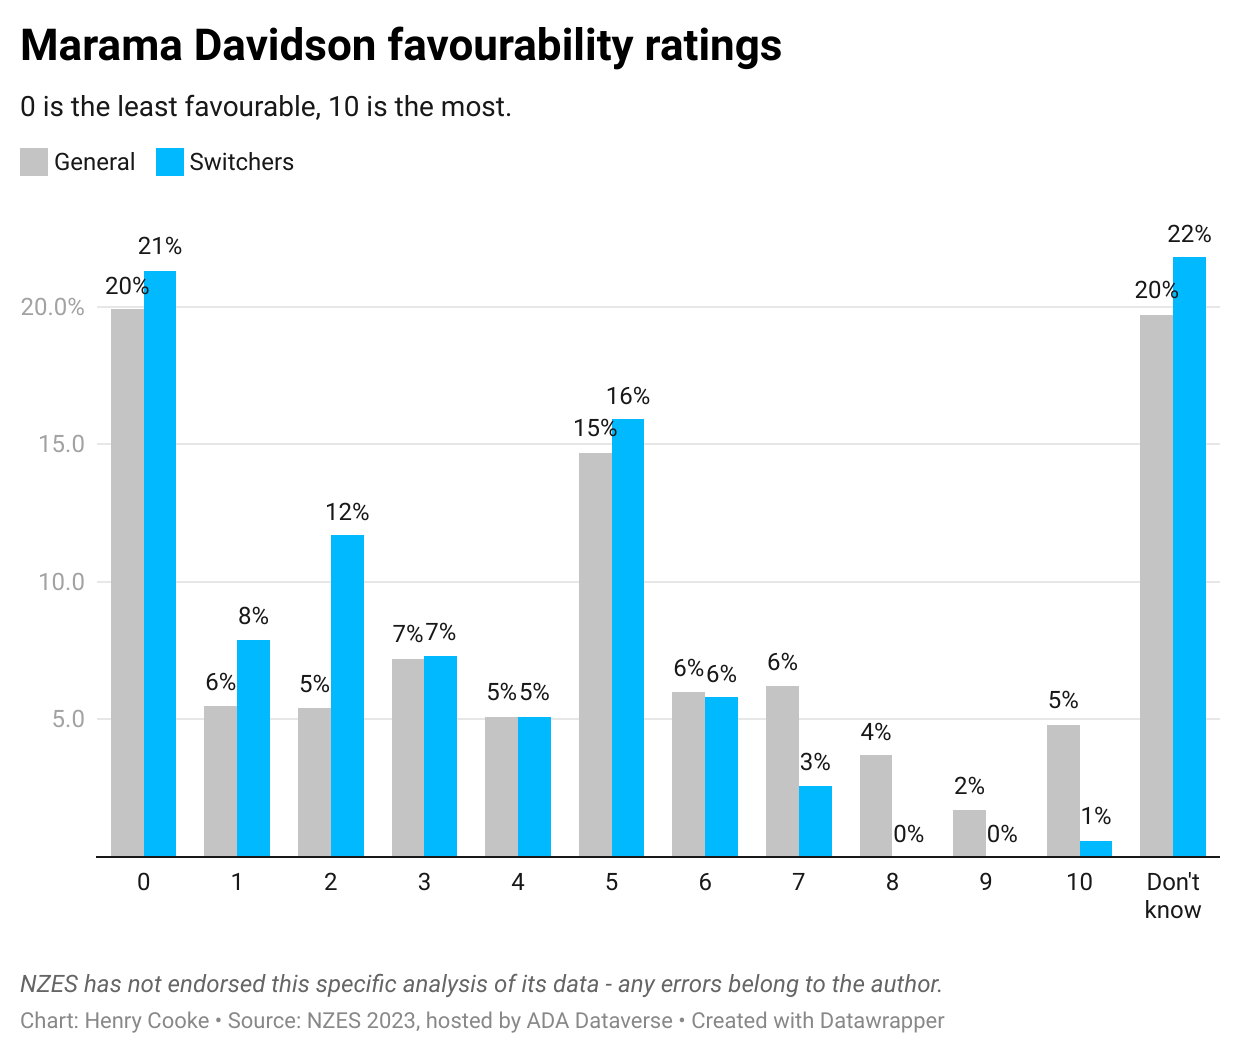
These aren’t great numbers for Davidson, but there is a big bunch of don’t knows. As Hipkins tries to win back these voters for a governing coalition that would have to involve Davidson, that may give him some hope.
Let’s get away from self-ratings and look at some actual issues. As everyone knows, it was a cost of living election fought as inflation raged. No one thought the economy was in a great place in late 2023. But these swing voters really didn’t like where it was.
As you can see, most Kiwis agreed the economy was getting worse. But these swingers were far more likely to think it had got a lot worse. We also know that this impacted their vote more than it did for others - 80% of switchers said the economy or inflation impacted their vote “a great deal”, compared to 69% of general electors.
Economic issues were inextricable from Covid-19 at the time, the issue that had won Labour such a big mandate in 2020 but had devolved into huge protests against vaccination and lockdowns by 2022.
Switchers were not anti-vaxxers. Just 2% told the NZES they hadn’t been vaccinated against Covid-19, compared to 5% of the wider sample. And when asked about how they felt about the general Covid response their answers were a real mix, but largely tracked the general population - being somewhat less likely to say they were either disgusted or proud of the response. These voters were not on the lawn at Parliament, and it is unlikely they will be following the news on the inquiry very closely.
What about policy issues?
At base, these voters appear to be right-leaning centrists economically and left-leaning centrists socially, until you mention the Treaty.
For example, they generally match the regular population in strongly disagreeing with the statement “Abortion is always wrong”.
But if you ask them whether the Treaty settlement process has gone too far or not far enough, they are very unlikely to say “not far enough”.
On wider spending issues, they are much like many Kiwis in generally wanting spending on general social services like Health to rise, or at least stay the same.
Similarly for law enforcement, where their results basically match the general population.
But when you move away from services and ask about the benefits system a larger difference emerges.
A slight majority want less spending on benefits overall, and this difference can also be seen if you ask the question from a more philosophical standpoint.
As you can see above, switchers are far less likely to strongly agree (and far more likely to “somewhat” disagree) with the more egalitarian proposition that income differences are too large.
Part of me wants to dive down into more issue-based questions here. But another part of me remembers that most voters do not follow politics as closely as the median Museum Street reader. And the data bears this out for switcher - they are generally less interested in politics than the wider population.
Committed partisans are generally the most interested in politics and we are explicitly not looking at committed partisans. That doesn’t mean these voters are rubes briefly looking away from Celebrity Treasure Island at the news once every three years before casting their votes - but it does mean that the ins and outs of policy debates on say, the Regulatory Standards Bill, are probably not front of mind for them.
Seducing the swingers
There is no perfect formula for winning over voters like these. 2020 was a high water mark for Labour it likely won’t reach again - meaning a certain proportion of these voters lost to National will probably never come back. But MMP elections are fought over very close margins and while Labour would love to win back votes from the Green Party, nothing will bolster their governing chances more than winning back votes from the other side.
Current polling suggests National are having a lot of trouble keeping hold of these voters. This isn’t too much of a surprise when you take a look at how much the economy mattered to their vote in 2023, and how little the general economic picture has improved. There is good news if you look for it, and the prospect of mortgage rates coming down could help National a lot, but we are not there yet, and Luxon has had a tricky time of convincing voters that we are on our way there. This may sound rosy for Labour, but its current strength is clearly very reliant on the economy staying in the toilet and the party being a bit of a blank slate. By election time the economy could have changed a lot - and Labour will have to tell these swing voters what it would actually do differently, a change that is likely to involve some kind of taxation on property. That could be very difficult to sell to these voters - to really swing, you need a set of house keys.
This will probably be my last political post for a while as I settle back into my new job at The Post, which I start in early September. Do look out for my work there - there’s going to be a lot more of it than I ever managed on this newsletter! But I do hope to return for various bits of writing that don’t quite fit anywhere else.
You may ask why I am not referring to these voters as “lost” for National. Two things. One is that I am writing the post earlier in the cycle, meaning National has more time to win back the swingers. Secondly, Labour had lost a lot more vote by the point I wrote that post (about a third of its total 2020 support), a big enough number to be sure that a big proportion of them were not coming back in 2023.
While I’m on technical detail - this data has all been weighted to represent the NZ voting age population.
For some reason Substack hated this chart so it’s an image. Sorry!
Worth reading to the end just for that last line 🤣 - thanks Henry
Ironically someone said something today and in my mind I thought “I need data on swing voters to form a view”. And voila. Thanks for a great article and good luck in the new role.